Python for Data Science: A Complete Learning Path
A practical, structured learning path for using Python in data science — what to learn, in what order, and which tools matter.

Python for Data Science: A Complete Learning Path
If you are learning Python so you can do data science, the question that actually matters is not "is Python worth it" but "what do I learn, and in what order, so I am not still stuck in tutorial loops six months from now." The tools that make this path concrete are a small, stable set: NumPy for arrays, pandas for tables, Matplotlib and seaborn for charts, scikit-learn for models, and Anaconda plus Jupyter to hold it all together. Master those in sequence and you can do most of the day-to-day work a junior data role asks for. The rest is practice on real datasets, which is where most learners actually get stuck.
I want to be honest about who this is for. This path fits someone who wants the operational mechanics: which library does what, when you reach for it, and what you can skip for now. If you want a deep statistics foundation first, this is not that piece, and I will point you to the statistics for data science fundamentals instead.
Why Python is the default language for data science
Look, the honest answer is network effects. Python won the data-science default slot not because it is the fastest language (it is not) but because the libraries clustered there and stayed. When the array library, the table library, and the modeling library all assume each other, you stop fighting glue code and start doing analysis. That is the whole pitch.
There is a real tradeoff, though. Python is slow at raw loops, so the entire stack pushes the heavy math down into compiled C underneath. You write readable Python; NumPy and friends run the numbers fast.

Most days you never notice the seam. The day you do notice it, you learn to vectorize, and that lesson is the actual skill.
What you actually need to learn (and in what order)
The order is the advice. Skip it and you will try to do machine learning before you can reliably load a CSV, which is a miserable way to learn.
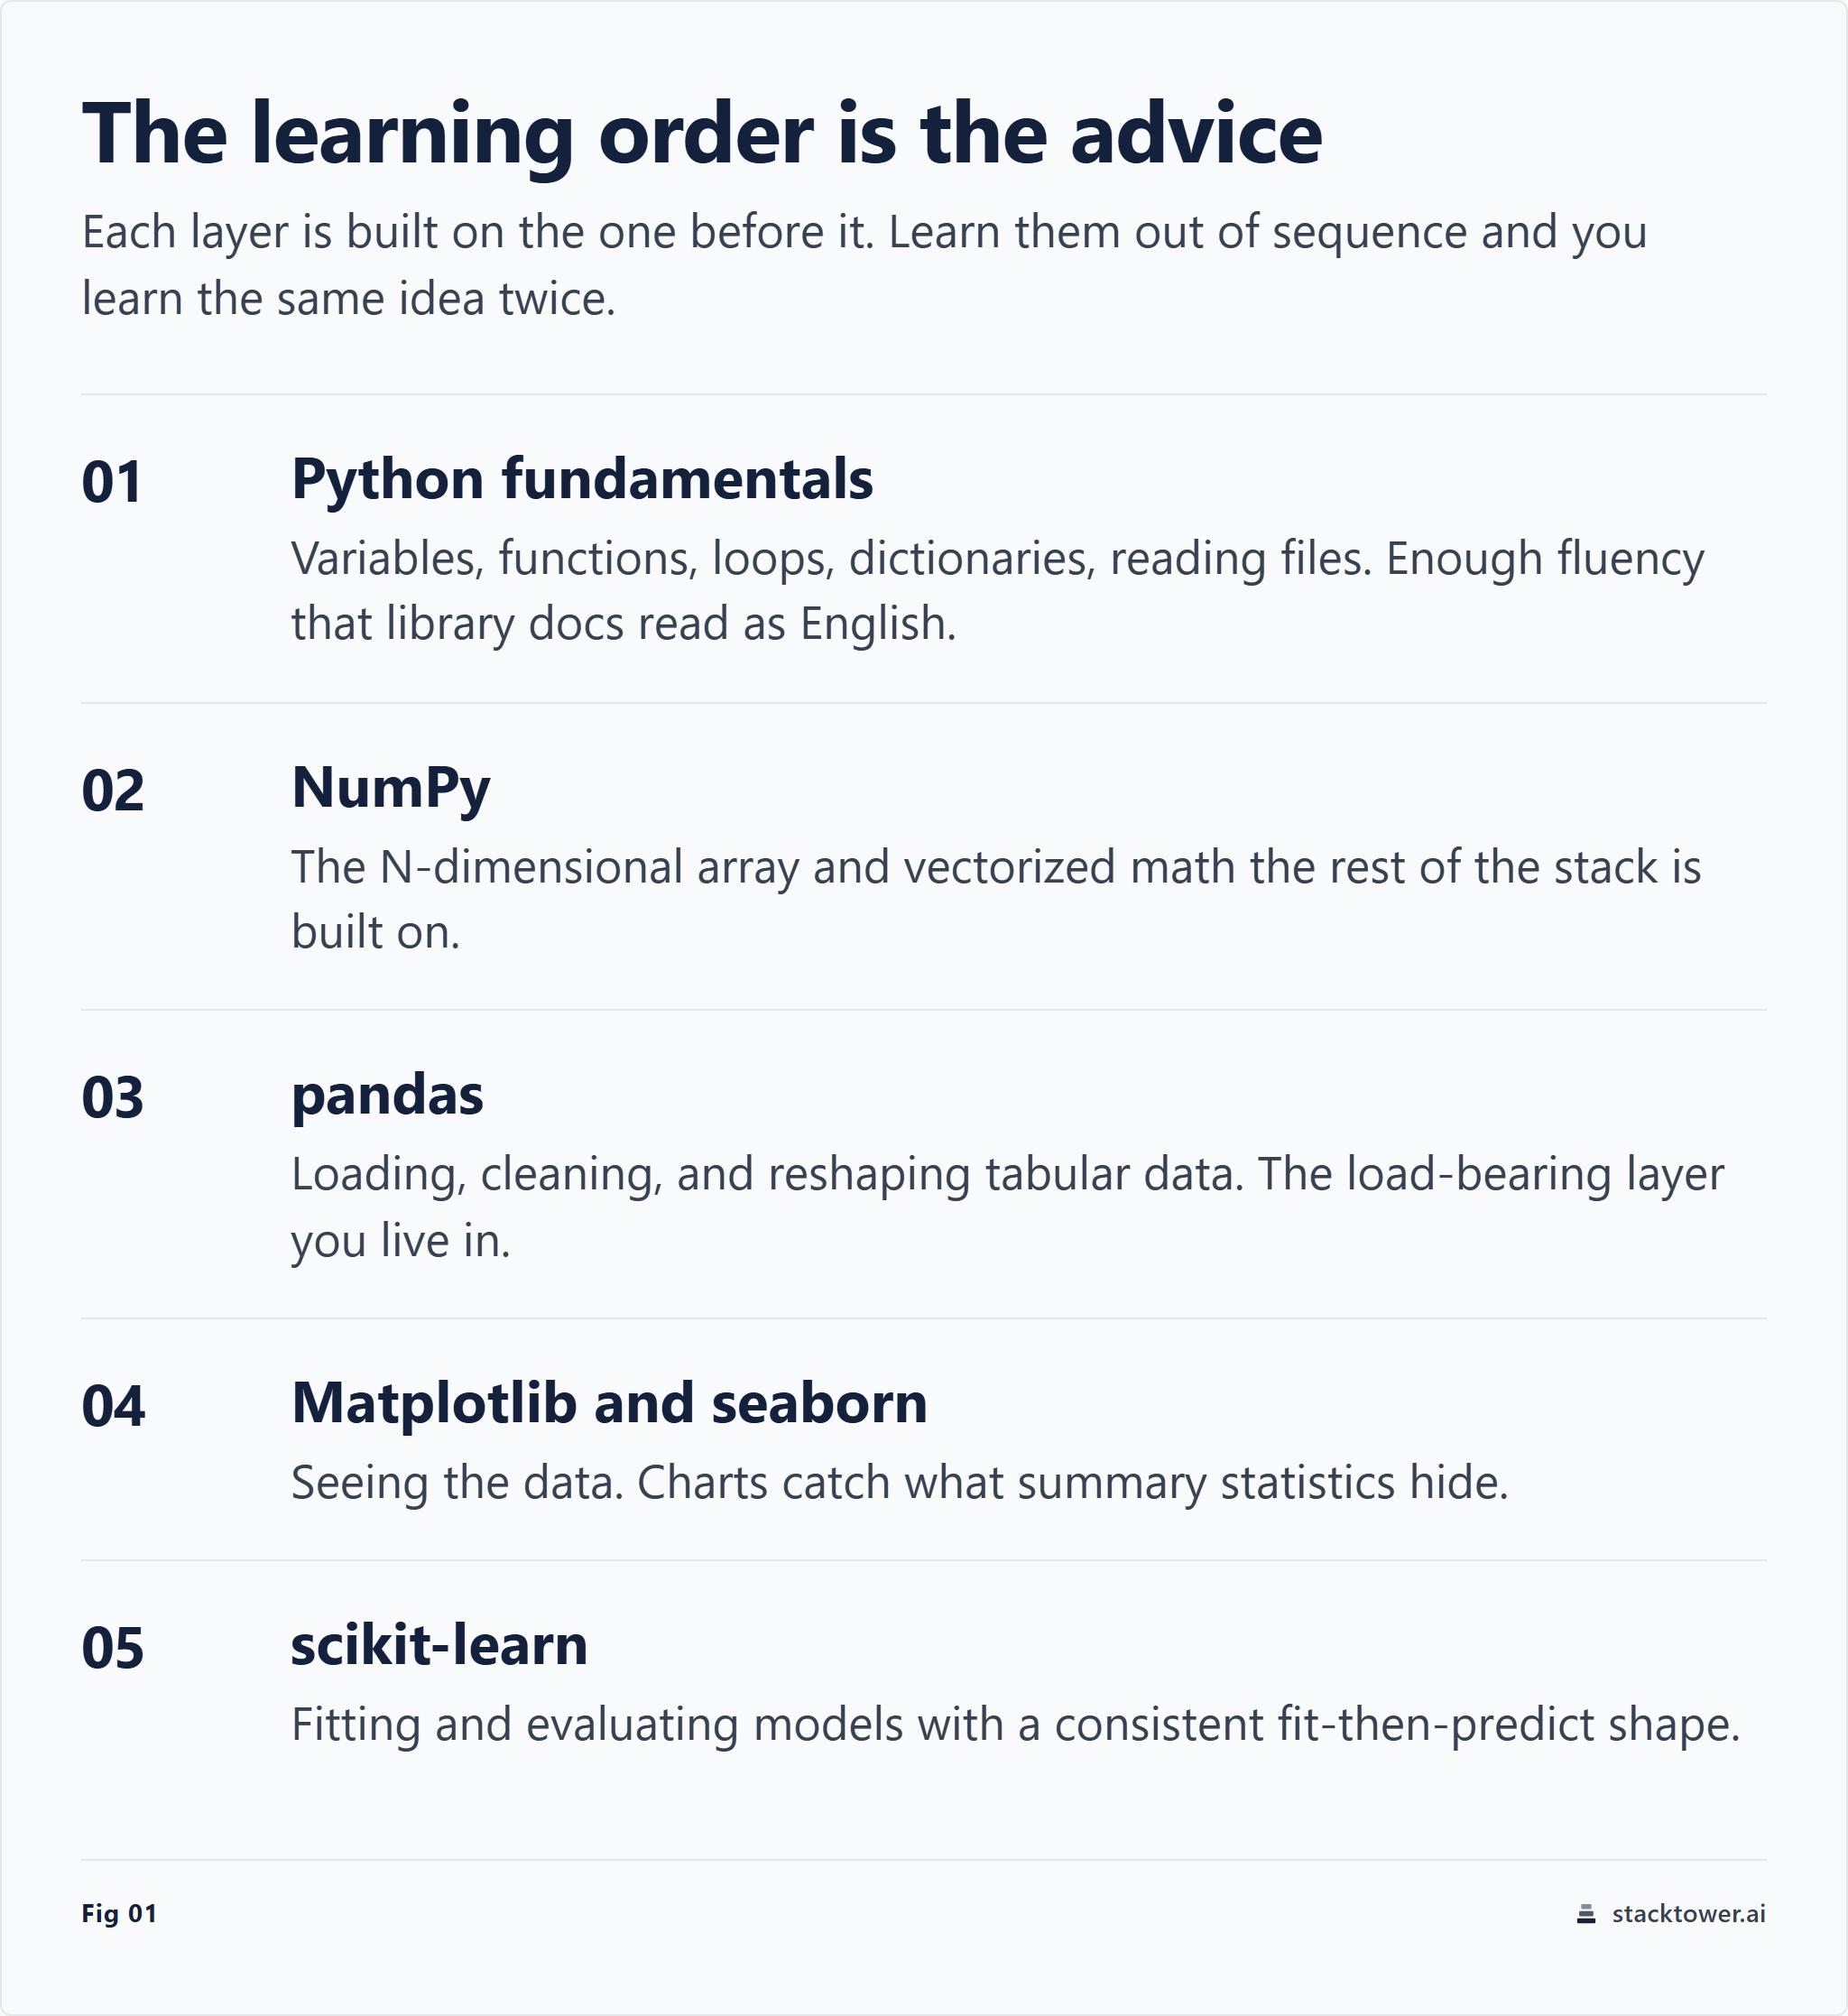
A representative ordered path covers Python fundamentals first, then NumPy and pandas, then Matplotlib and seaborn, then scikit-learn1. I keep coming back to why the order holds: each layer is built on the one before it, so learning them out of sequence means learning the same idea twice.
- Python fundamentals: variables, functions, loops, dictionaries, reading files.
- NumPy: arrays and vectorized math.
- pandas: loading, cleaning, and reshaping tabular data.
- Matplotlib and seaborn: seeing the data.
- scikit-learn: fitting and evaluating models.
You will not finish step one before peeking at step three. That is fine. The order is a center of gravity, not a prison.
Step 1: Python fundamentals before any library
Here is the part people skip and regret. Before you touch a single library, you need the plain language: how a function returns a value, how a list differs from a dictionary, how to read a file without a tutorial open in the other tab.
- Vectorization
- Vectorization means expressing an operation over a whole array at once instead of looping element by element, so the math runs in compiled code rather than slow Python loops.
- DataFrame
- A DataFrame is a two-dimensional labeled table, the central pandas structure, with named columns and an index for rows.
You do not need object-oriented design patterns yet. You do not need decorators. You need enough fluency that the library docs read as English, not as a wall. Two to three weeks of focused fundamentals saves you months of confusion downstream. If you want a structured starting sequence, our Python basics for beginners guide walks the minimum set.
Step 2: NumPy for numerical arrays
NumPy is where the stack actually begins. NumPy provides the N-dimensional ndarray array object and fast vectorized numerical operations that the rest of the Python data-science stack is built on2. That sentence is doing a lot of work, so let me unpack it.
The ndarray is a grid of numbers that lives in one contiguous block of memory. Because of that layout, an operation like "add 5 to every element" runs as a single compiled instruction over the whole block, not a Python loop. This is vectorization, and it is the mental shift that separates someone who writes fast data code from someone who waits.
You will not spend long here as a standalone topic. A week, maybe less. But every later library leans on this, so the time is not optional. When pandas does something fast, NumPy is the reason. When scikit-learn takes your data as input, it wants arrays. Learn the array, and the rest stops feeling like magic.
Step 3: pandas for data manipulation
This is the load-bearing section, and it is where you will spend the most time by far. pandas is built on top of NumPy and provides DataFrame and Series structures for labeled data, filtering, grouping, joining, and handling missing values3. In practice that means pandas is the tool you live in.
Real data is filthy. Columns have the wrong type. Dates are strings. Some rows are missing a value, and another batch has it spelled several different ways. The actual job of data work, the unglamorous majority of it, is getting that mess into a clean table you can trust. pandas is the instrument for that, and getting fluent in it is the single highest-leverage thing on this whole path.
A Series is a single labeled column. A DataFrame is a collection of Series sharing one index. Once that clicks, the operations follow: select rows by condition, group by a category and aggregate, join two tables on a shared key, fill or drop the gaps. I will be blunt: if you can do those four things cleanly under light pressure, you are past the hardest filter most junior data roles apply in a take-home.
The trap here is tutorial comfort. You can watch pandas videos for weeks and feel productive while learning almost nothing transferable. The fix is to pull a messy public dataset, give yourself a real question, and answer it. You will hit a wall the tutorial never mentioned. Good. That wall is the lesson. Our pandas data cleaning walkthrough works one such dataset end to end if you want a worked example to push against.
Step 4: Matplotlib and seaborn for visualization
You cannot trust a dataset you have not looked at. Charts catch what summary statistics hide.
Matplotlib is a comprehensive library for static, animated, and interactive visualizations, and it underpins higher-level libraries such as seaborn4. seaborn is based on matplotlib and provides a high-level interface for statistical graphics5. So the relationship is layered: Matplotlib gives you full control and a steeper learning curve; seaborn gives you good-looking statistical charts in one line and reaches down to Matplotlib when you need to fine-tune.
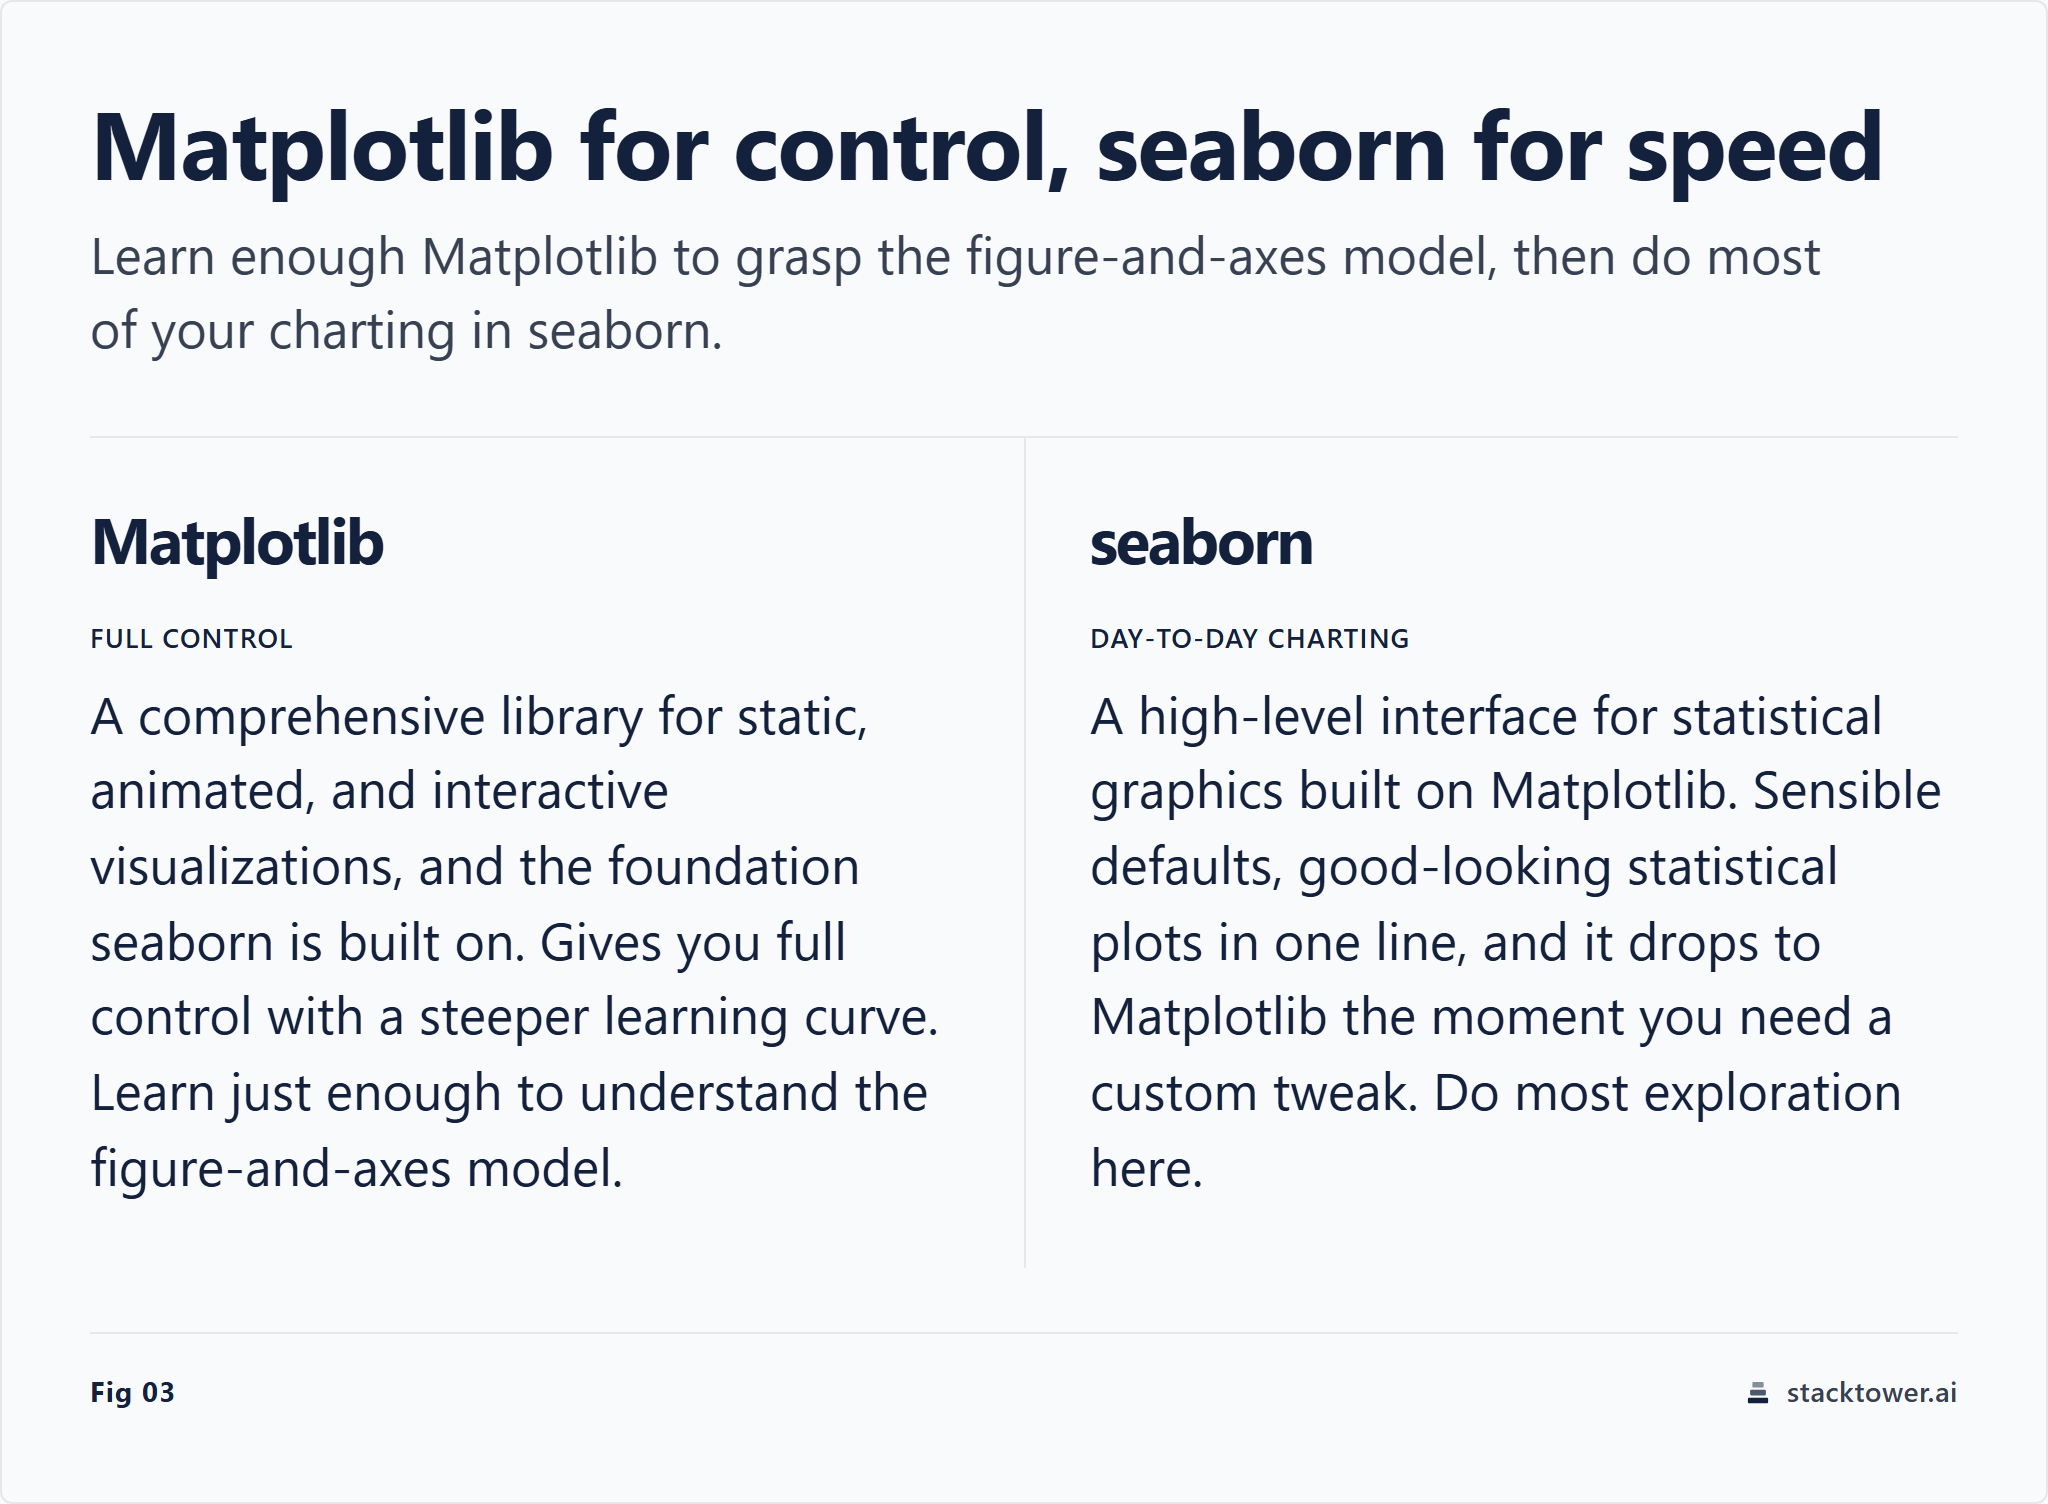
My advice, and I will commit to it: learn just enough Matplotlib to understand the figure-and-axes model, then do most of your day-to-day charting in seaborn. The reason is leverage. Seaborn's defaults are sensible, its statistical plots are exactly the ones you reach for during exploration, and it drops to Matplotlib the moment you need a custom tweak. Skipping straight to seaborn without the Matplotlib mental model is the common mistake; you get stuck the first time you need to change something the high-level call does not expose.
Step 5: scikit-learn for machine learning
Now the part everyone rushed toward. scikit-learn provides tools for classification, regression, clustering, dimensionality reduction, model selection, and preprocessing, built on NumPy, SciPy, and matplotlib6. The thing that makes it teachable is consistency: nearly every model exposes the same fit then predict shape, so once you have trained one, you have trained most of them.
The skill that actually matters here is not picking the fanciest algorithm. It is evaluation. Can you split your data so you are not testing on what you trained on? Can you tell whether a model is genuinely good or just memorizing? That discipline is the difference between a demo and something you would let touch a decision.
Start with one simple, interpretable model on a clean dataset and get the whole loop working: split, fit, predict, evaluate. Then vary one thing at a time.
Setting up your environment with Anaconda and Jupyter
Tooling setup defeats more beginners than the math does, which is a little absurd, so here is the shortcut.
The Anaconda Distribution bundles Python with the conda package manager and pre-installs NumPy, pandas, matplotlib, scikit-learn, and Jupyter, so beginners avoid manual dependency setup7. Install one thing, get the whole toolkit, skip the dependency-hell rite of passage. You can graduate to managing your own virtual environments later, once you have a reason to care.
Jupyter notebooks combine live code, visualizations, and narrative text, and they are the standard surface for exploratory data analysis in Python8. That mix is exactly what exploration wants: run a cell, see the chart right under it, write a note about what you found, run the next cell. It is a thinking tool, not just an editor.
How long the path takes and how to practice
I will give you the cohort-honest version. Most motivated learners who study consistently reach junior-level competence on this stack in roughly three to six months. That range is wide on purpose: it depends on prior programming exposure and, more than anything, on how much you build versus how much you watch.
Practice beats consumption, and it is not close. Here is the loop that works:
- Pick a real dataset that you genuinely want a question answered about.
- Load and clean it in pandas until you trust it.
- Chart it in seaborn until something surprises you.
- Model the surprise in scikit-learn and check whether the model holds up.
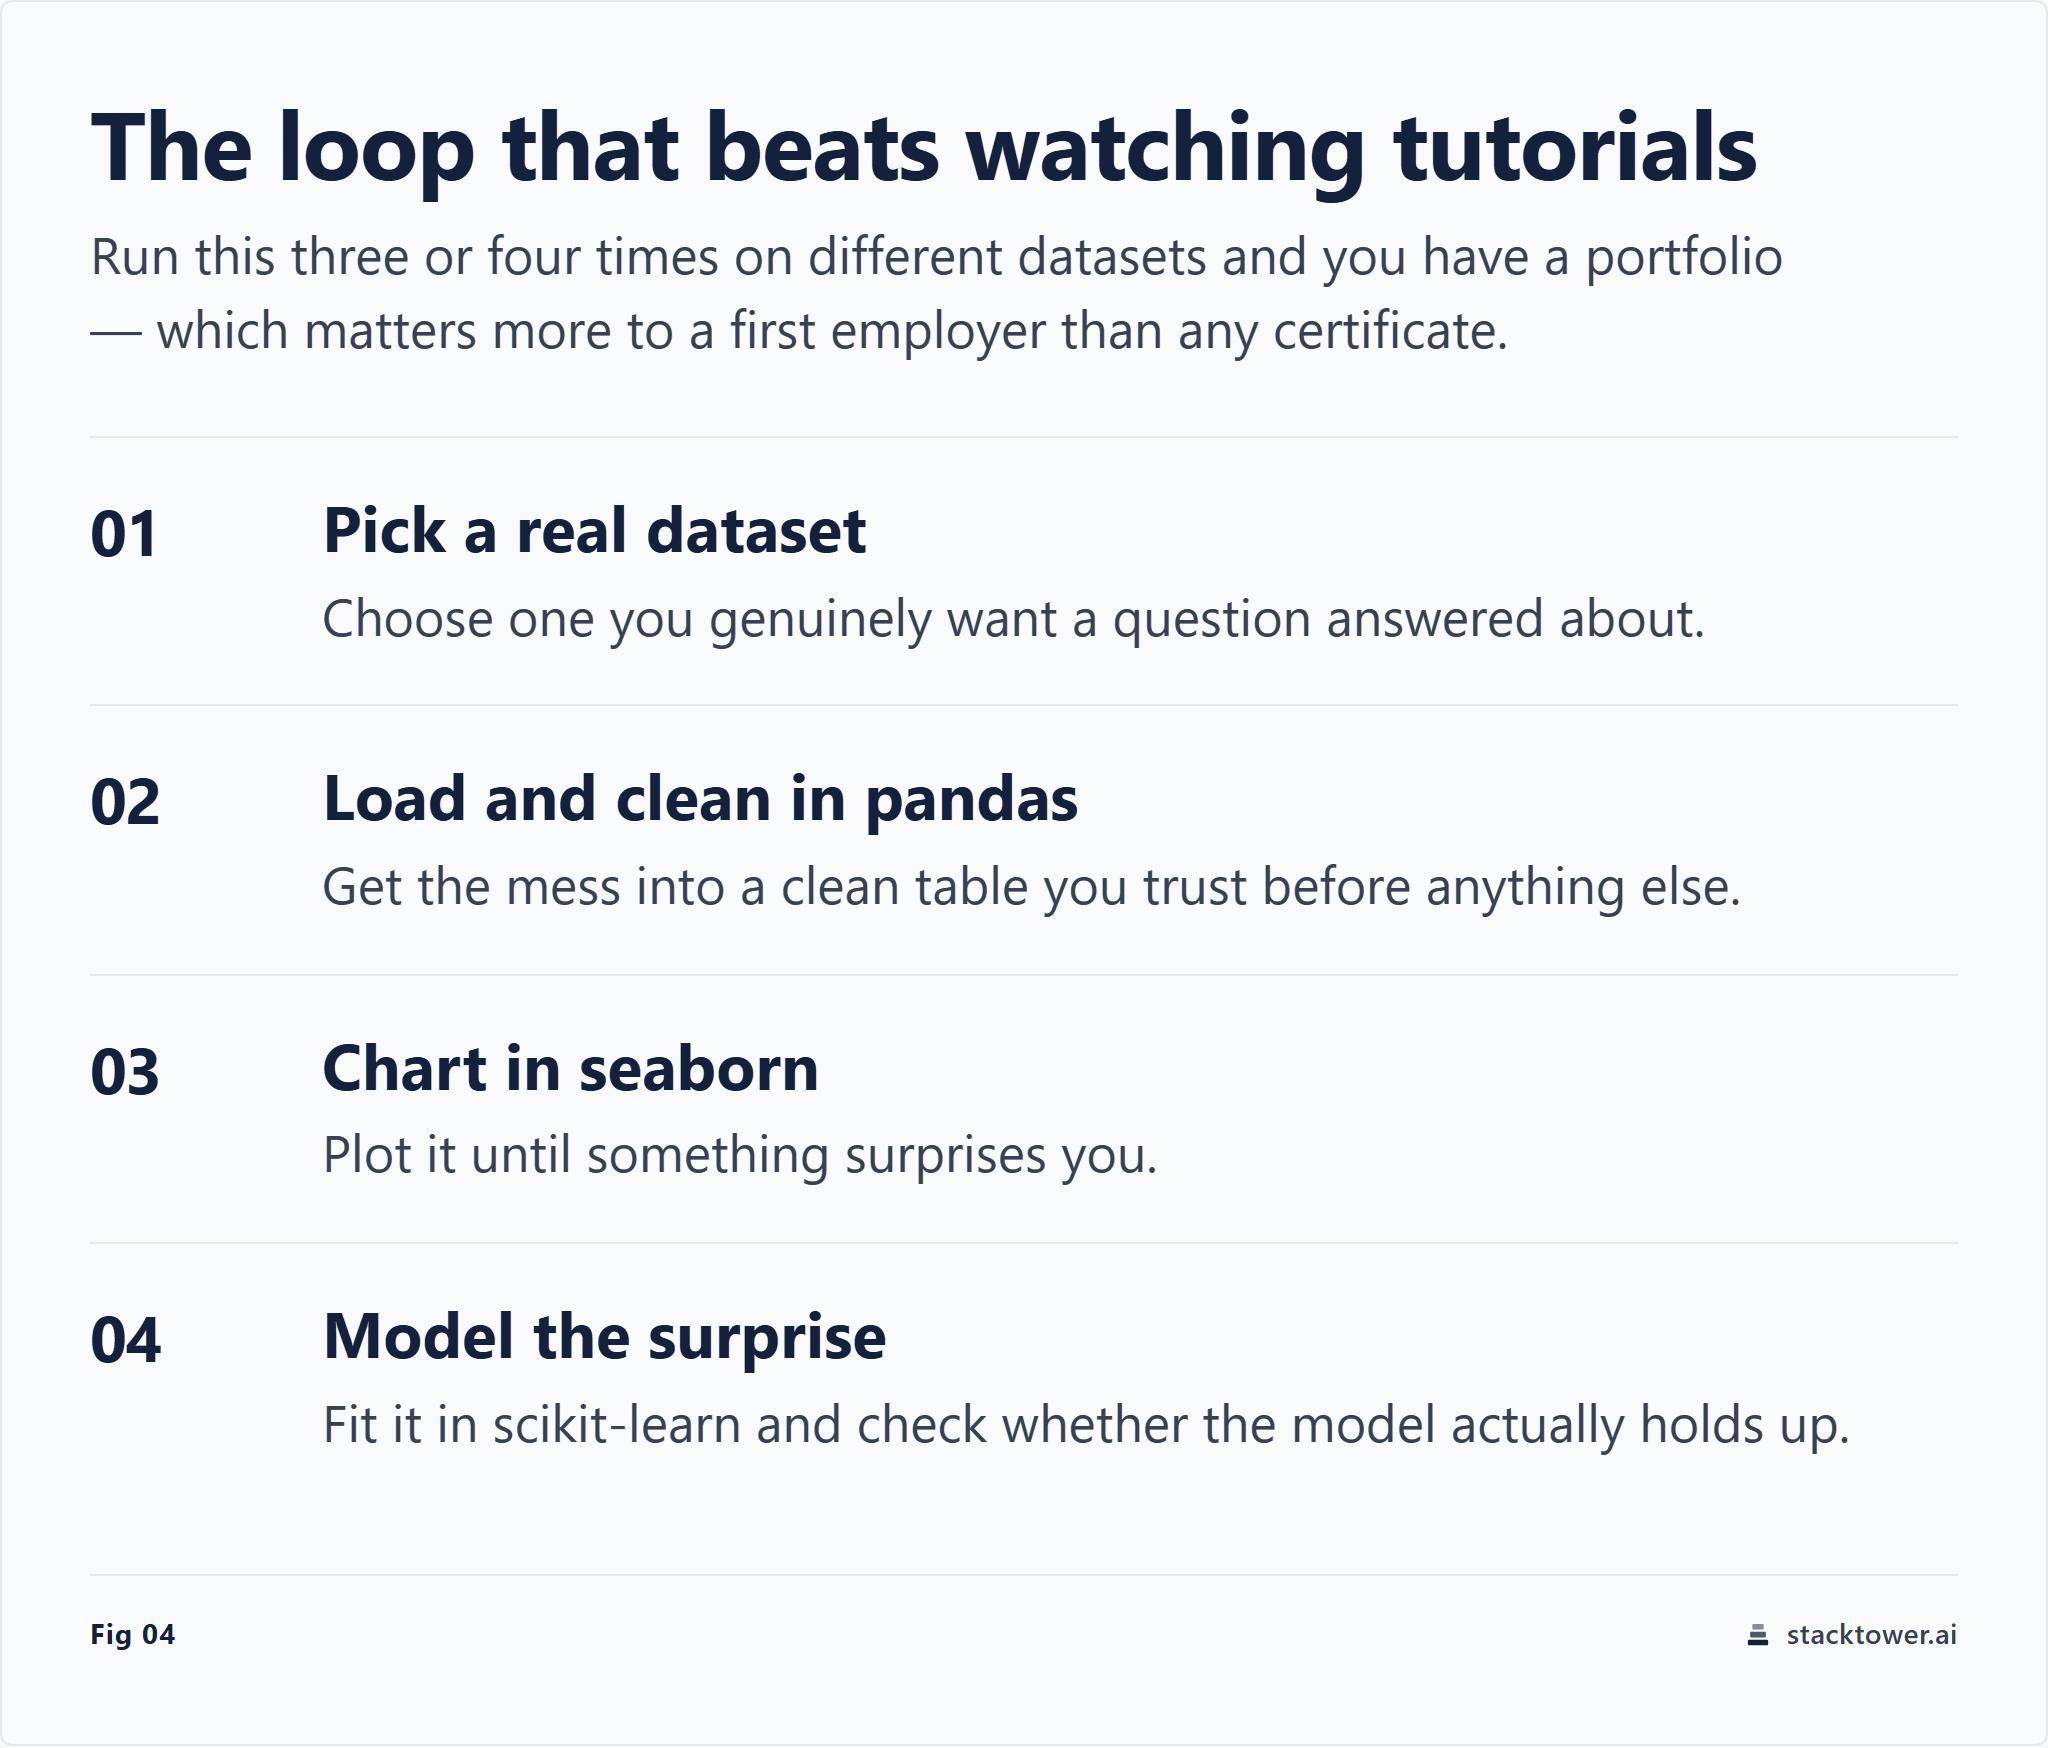
Do that three or four times on different datasets and you will have a portfolio, which matters more to a first employer than any certificate. Though, fair enough, a structured course can give you the scaffolding if self-direction is hard early on. Our data science portfolio projects guide lists starter dataset ideas worth stealing.
Where to go next: deep learning and specialization
So you have the core five down. What now? Honestly, do not rush past competence into novelty. The core stack handles a startling amount of real work, and "I reached for a neural net when a logistic regression would have done" is a common rookie tell.
When you do branch out, branch by problem, not by hype. Working mostly with images or text at scale? That is when deep-learning frameworks earn their keep. Doing classic tabular prediction? Gradient-boosted trees often beat fancier methods and the core stack already gets you most of the way.
I can describe the path that works for most of the people who walk it. I can't tell you whether you specifically will love the modeling more than the cleaning, or whether you will end up an analyst, an engineer, or somewhere in between. Treat this sequence as one input. The order is sound; the destination is yours to pick.
Footnotes
-
A representative ordered learning path covers Python fundamentals, then NumPy and pandas, then matplotlib and seaborn, then scikit-learn. — Data Science With Python Core Skills (Learning Path) – Real Python ↩
-
NumPy provides the N-dimensional ndarray array object and fast vectorized numerical operations that the rest of the Python data-science stack is built on. — The N-dimensional array (ndarray) — NumPy v2.4 Manual ↩
-
pandas is built on top of NumPy and provides DataFrame and Series structures for labeled data, filtering, grouping, joining and handling missing values. — Package overview — pandas 3.0.3 documentation ↩
-
Matplotlib is a comprehensive library for static, animated and interactive visualizations and underpins higher-level libraries such as seaborn. — Matplotlib 3.10.9 documentation ↩
-
seaborn is based on matplotlib and provides a high-level interface for statistical graphics. — seaborn: statistical data visualization — seaborn 0.13.2 documentation ↩
-
scikit-learn provides tools for classification, regression, clustering, dimensionality reduction, model selection and preprocessing, built on NumPy, SciPy and matplotlib. — scikit-learn: machine learning in Python — scikit-learn 1.9.0 ... ↩
-
The Anaconda Distribution bundles Python with the conda package manager and pre-installs NumPy, pandas, matplotlib, scikit-learn and Jupyter so beginners avoid manual dependency setup. — Linux installer - Anaconda ↩
-
Jupyter notebooks combine live code, visualizations and narrative text and are the standard surface for exploratory data analysis in Python. — Project Jupyter Documentation — Jupyter Documentation 4.1.1 alpha documentation ↩